
Event instrumentation review
Map every screen, tap, and conversion event so your analytics stack records what the product actually does.

Concrete analytics engagements for product and engineering teams—scoped in weeks, delivered with definitions your org can keep.
Map every screen, tap, and conversion event so your analytics stack records what the product actually does.

Find where users drop between install, activation, and the moment that matters for your business.
Understand who comes back, who fades, and which product moments predict stickiness.

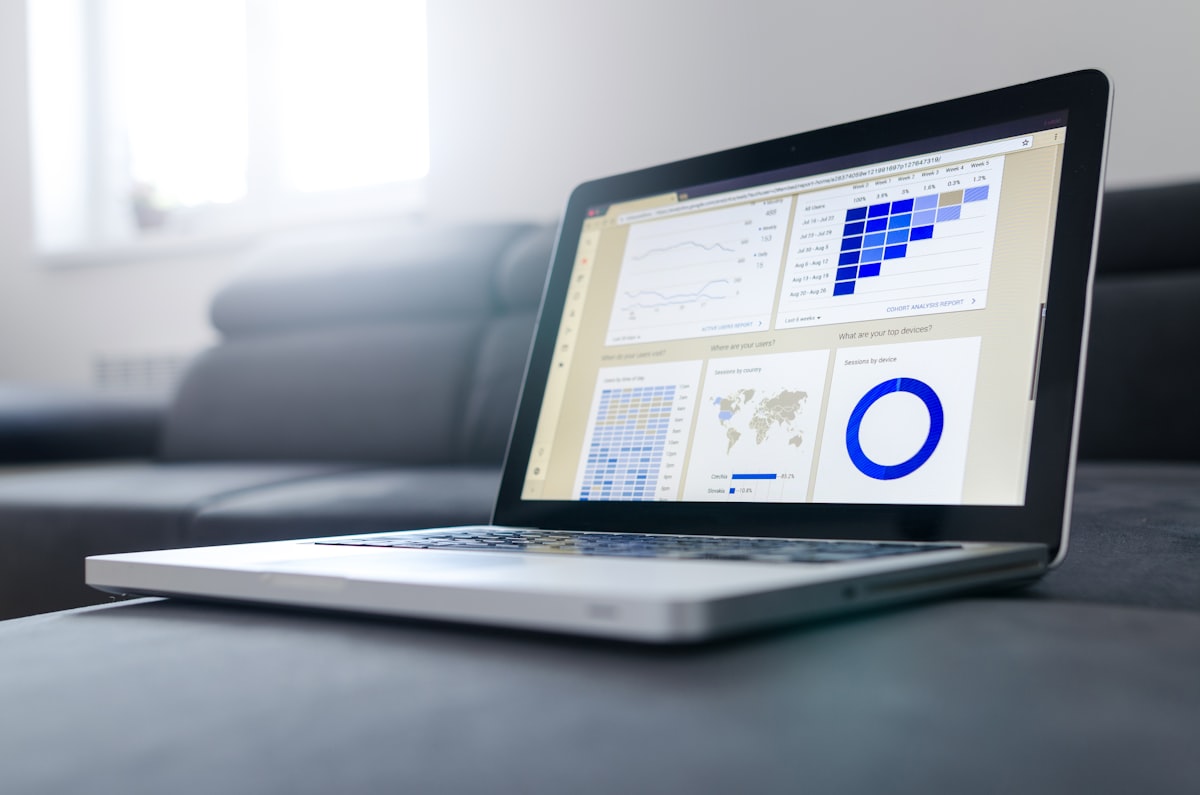
Build living dashboards your PMs and engineers open weekly—not monthly reports nobody trusts.
Turn experiment results into a clear ship / iterate / kill decision with honest statistical framing.

iOS and Android tracking health check covering SDK versions, deep links, and offline event queues.